Monitoring
Metrics for prometheus
version: '3'
services:
  ntfy:
    image: binwiederhier/ntfy
    restart: unless-stopped
    environment:
      NTFY_BASE_URL: https://my-domain
      NTFY_BEHIND_PROXY: true
      NTFY_ATTACHMENT_CACHE_DIR: /var/lib/ntfy/attachments
      NTFY_CACHE_FILE: /var/lib/ntfy/cache.db
      NTFY_UPSTREAM_BASE_URL: https://ntfy.sh
      NTFY_ENABLE_LOGIN: true
      NTFY_AUTH_FILE: /var/lib/ntfy/auth.db
      NTFY_AUTH_DEFAULT_ACCESS: deny-all
      NTFY_ENABLE_METRICS: true             #Enable the metrics endpoint /metrics
    volumes:
      - ./:/var/lib/ntfy
    ports:
      - 4280:80
    command: serve
    expose:
    - "9090"                                #Expose port for Prometheus


  prometheus:
    image: prom/prometheus
    volumes:
      - /home/user/dockers/prometheus/config/:/etc/prometheus/
    ports:
      - 9090:9090
    restart: unless-stopped
Comingafter soonyou have updated your NTFY stack with prometheus you juste need to add the target to your prometheus.yml
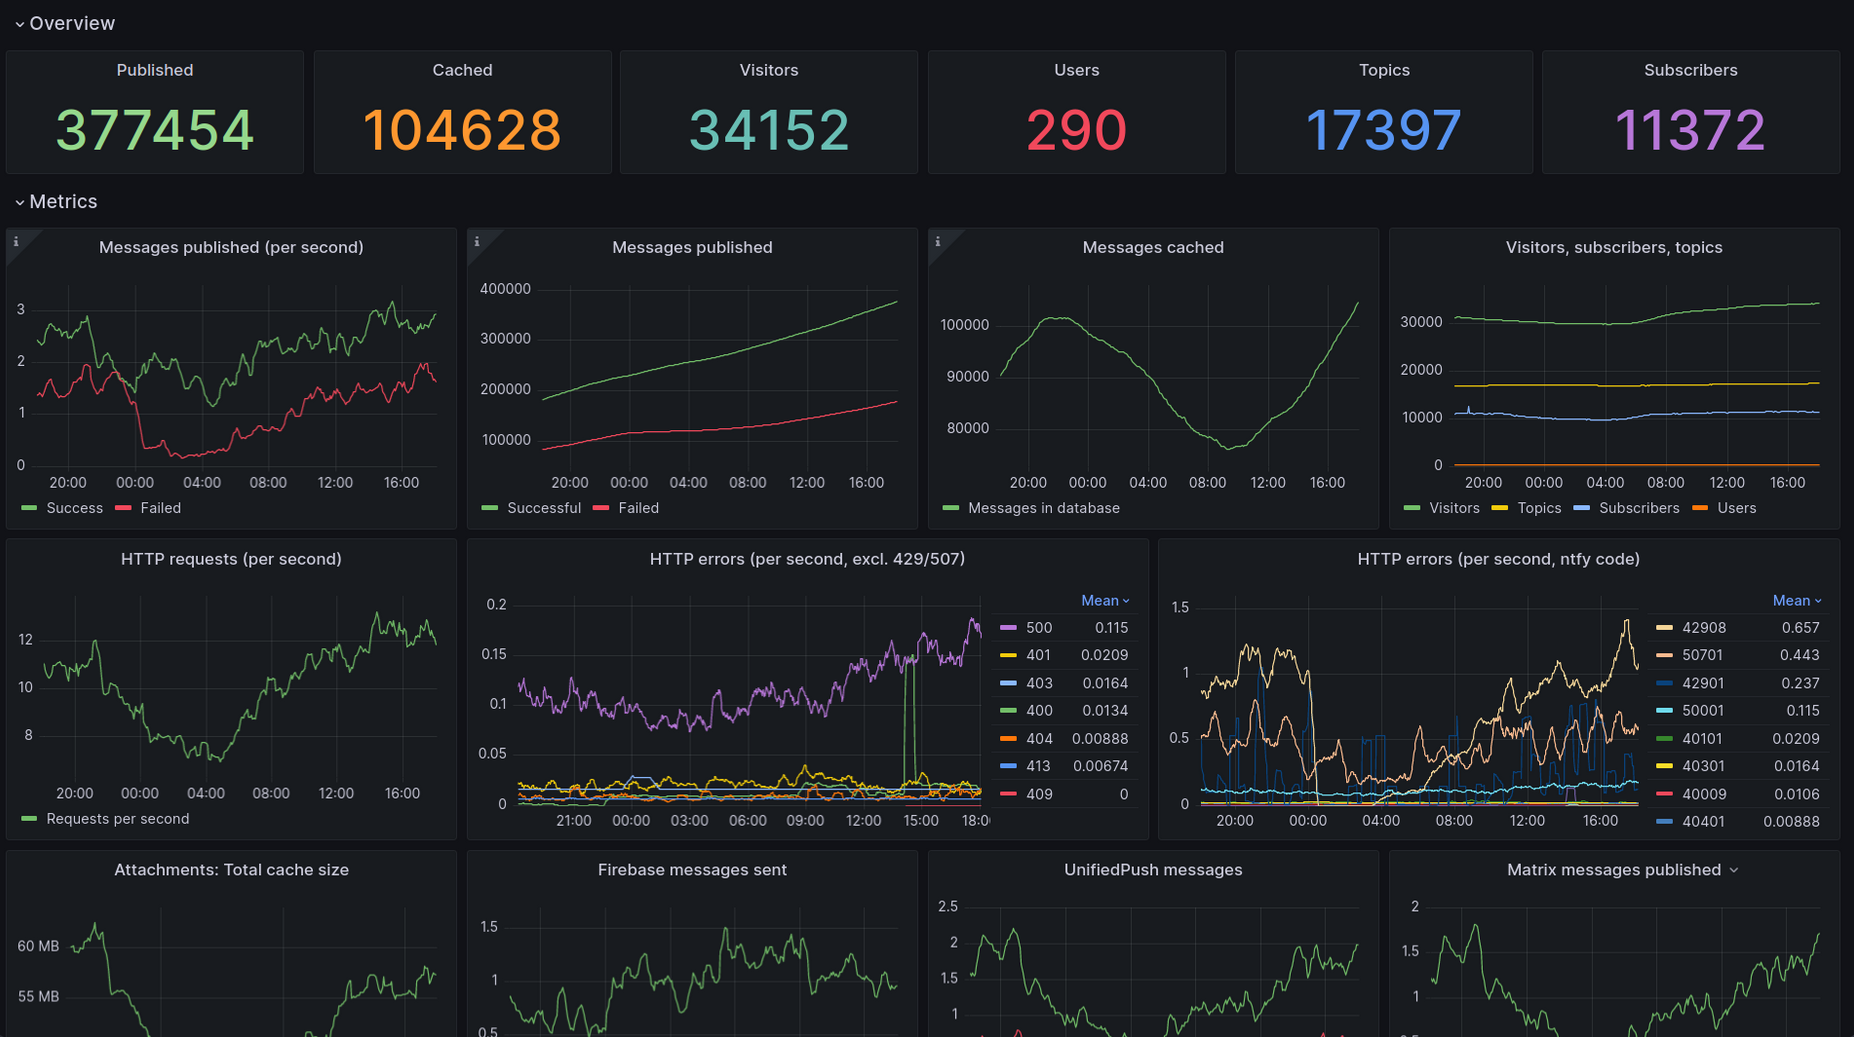
Grafana dashboard
You can find a pretty decent Grafana dashboard created by the ntfy creator on his github